Type of resources
Available actions
Topics
Keywords
Contact for the resource
Provided by
Years
Formats
Representation types
Update frequencies
status
Service types
Scale
Resolution
-
The EMODnet (European Marine Observation and Data network) Geology project collects and harmonizes marine geological data from the European sea areas to support decision making and sustainable marine spatial planning. The partnership includes 39 marine organizations from 30 countries. The partners, mainly from the marine departments of the geological surveys of Europe (through the Association of European Geological Surveys-EuroGeoSurveys), have assembled marine geological information at various scales from all European sea areas (e.g. the White Sea, Baltic Sea, Barents Sea, the Iberian Coast, and the Mediterranean Sea within EU waters). This dataset includes EMODnet seabed substrate maps at a scale of 1:60 000 from the European marine areas. Traditionally, European countries have conducted their marine geological surveys according to their own national standards and classified substrates on the grounds of their national classification schemes. These national classifications are harmonised into a shared EMODnet schema using Folk's sediment triangle with a hierarchy of 16, 7 and 5 substrate classes. The data describes the seabed substrate from the uppermost 30 cm of the sediment column. Further information about the EMODnet Geology project is available on the portal (http://www.emodnet-geology.eu/).
-
The EMODnet (European Marine Observation and Data network) Geology project collects and harmonizes marine geological data from the European sea areas to support decision making and sustainable marine spatial planning. The partnership includes 39 marine organizations from 30 countries. The partners, mainly from the marine departments of the geological surveys of Europe (through the Association of European Geological Surveys-EuroGeoSurveys), have assembled marine geological information at various scales from all European sea areas (e.g. the White Sea, Baltic Sea, Barents Sea, the Iberian Coast, and the Mediterranean Sea within EU waters). This dataset includes EMODnet seabed substrate maps at a scale of 1:10 000 from the European marine areas. Traditionally, European countries have conducted their marine geological surveys according to their own national standards and classified substrates on the grounds of their national classification schemes. These national classifications are harmonised into a shared EMODnet schema using Folk's sediment triangle with a hierarchy of 16, 7 and 5 substrate classes. The data describes the seabed substrate from the uppermost 30 cm of the sediment column. Further information about the EMODnet Geology project is available on the portal (http://www.emodnet-geology.eu/).
-
KUVAUS: Aineisto sisältää raitiotien katusuunnitelmien reitit Tampereen alueelta sekä linkkejä suunnitelmapiirustuksiin. KATTAVUUS: Kaikille käyttäjille Oskari-karttapalvelussa. PÄIVITYS: Aineistoa päivitetään tarpeen mukaan (ylläpito jatkuvaa). YLLÄPITOSOVELLUS: PostgreSQL-tietokanta ja QGIS-ohjelmisto. KOORDINAATTIJÄRJESTELMÄ: Aineisto tallennetaan ETRS-GK24FIN (EPSG:3878) tasokoordinaattijärjestelmässä. GEOMETRIA: vektori (viiva) SAATAVUUS: Aineisto on saatavilla WFS-rajapinnalta Tampereen kaupungin sisäiseen käyttöön. JULKISUUS: Kaikille käyttäjille Oskari-karttapalvelussa. AINEISTOSTA VASTAAVA TAHO: Tampereen kaupunki, Kuntatekniikan suunnittelu
-

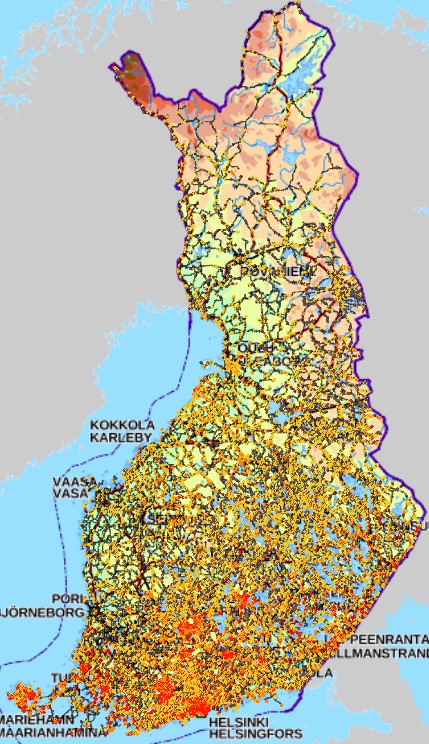
FIN Aineiston tarkoituksena on: -Identifioida tie- ja rata-alueet, joiden varrella esiintyy uhanalaisia ja silmälläpidettäviä lajeja -Identifioida tie- ja rata-alueet, joiden varrella esiintyy hyviä elinvoimaisia niittyindikaattorilajeja (hyönteisten mesi- ja ravintokasveja) -Identifioida tie- ja rata-alueet, joiden varrella esiintyy suojelualueita -Identifioida tie- ja rata-alueet, joiden varrella esiintyy komealupiinia tai kurtturuusua -Identifioida tie- ja rata-alueet, joiden varrella esiintyy komealupiinia tai kurtturuusua uhanalaisten lajien lisäksi -> Löytää herkät alueet ja paikallistaa vieraslajien uhka Tieto esitetään 1 kilometrin ruuduissa. Aineistosta on julkaistu kaksi erillistä versiota. -VaylanvarsienVieraslajitJaArvokkaatElinymparistot_avoin: Avoin versio, jonka lajitietoa on karkeistettu mahdollisista herkistä lajeista johtuen. Aineisto kuuluu SYKEn avoimiin aineistoihin (CC BY 4.0) ja sitä saa käyttää lisenssiehtojen mukaisesti -VaylanvarsienVieraslajitJaArvokkaatElinymparistot_kayttorajoitettu: Alkuperäinen karkeistamaton versio. Tämä versio on vain viranomaiskäyttöön eikä kyseistä aineistoa saa jakaa Aineistosta on tehty tarkempi menetelmäkuvaus https://geoportal.ymparisto.fi/meta/julkinen/dokumentit/VierasVayla_Menetelmakuvaus.pdf sekä muuttujaseloste https://geoportal.ymparisto.fi/meta/julkinen/dokumentit/VierasVayla_VariableDescription.xlsx ENG The purpose of the material is to: -Identify road and rail areas that have nearby observations of endangered and near threatened species -Identify road and rail areas with good meadow indicator plant species -Identify road and rail areas along which there are protected areas -Identify the road and rail areas along which there are observations of Lupinus polyphyllus or Rosa rugosa observations -Identify the road and rail areas along which there are Lupinus polyphyllus or Rosa rugosa observations in addition to sensitive species -> Finds sensitive areas and identify the overall threat of alien species The data is presented in 1-kilometer square grid cells. There are two separate versions of the data. -VaylanvarsienVieraslajitJaArvokkaatElinymparistot_avoin: Open access version, in which its species-related parts have been simplified due to data restriction issues. The material belongs to Syke's open materials (CC BY 4.0) and may be used in accordance with the license terms. -VaylanvarsienVieraslajitJaArvokkaatElinymparistot_kayttorajoitettu: Original version. This version is only for official use and the material in question may not be shared. A more precise description about the data procedures can be found from (In Finnish) https://geoportal.ymparisto.fi/meta/julkinen/dokumentit/VierasVayla_Menetelmakuvaus.pdf Furthermore, all the variables in the data are explained in this bilingual variable description https://geoportal.ymparisto.fi/meta/julkinen/dokumentit/VierasVayla_VariableDescription.xlsx This dataset was updated with the newest species observations on 10/2023 and 11/2024 Process code for this can be found from https://github.com/PossibleSolutions/VierasVayla_SpeciesUpdate
-
KUVAUS Herkät vesistöt, joiden rajaus on luotu Viherkertoimen käyttöä varten. Viherkerroinmenetelmä on ekologinen suunnittelutyökalu tonttien viherpinta-alan arviointiin, minkä avulla etsitään vaihtoehtoisia ratkaisutapoja kaupunkivihreän lisäämiseen sekä hulevesien hallintaan. Määritellyillä alueilla huleveden laadulliseen hallintaan on kiinnitettävä erityistä huomiota. Aineisto perustuu hulevesiohjelmassa määritettyihin osavaluma-alueisiin, joiden avulla aineisto on rajattu. Aineisto on päivitetty 12/2023 vastaamaan uuden hulevesiohjelman valuma-alueita. Hulevesiohjelmaan liittyvän aineiston lisäksi rajausta on arvioitu asiantuntijoiden toimesta. KATTAVUUS Koko kaupunki PÄIVITYS Aineisto on laadittu viherkertoimen käyttöön ja päivittyy tiedon tarkentuessa. YLLÄPITOSOVELLUS Aineisto on tallennettu PostgreSQL-tietokantaan ja ylläpidetään QGIS-ympäristössä. KOORDINAATISTOJÄRJESTELMÄ Aineisto tallennetaan ETRS-GK24 (EPSG:3878) tasokoordinaattijärjestelmässä. GEOMETRIA Aluemainen SAATAVUUS Aineisto on saatavilla WFS- ja WMS2-rajapinnoilta. JULKISUUS, TIETOSUOJA. Avoin aineisto. VASTUUTAHO Ympäristönsuojeluyksikkö (ymparistonsuojelu@tampere.fi) KENTÄT vesisto: vesistöalueen nimi
-
The Baltic Sea Pressure Index is a calculation of quantity and spatial distribution of potential cumulative impacts on the Baltic Sea. The BSII is based on georeferenced datasets of human activities (36 datasets), pressures (18 datasets) and ecosystem components (36 datasets), and on sensitivity estimates of ecosystem components (so-called sensitivity scores) that combine the pressure and ecosystem component layers, created in <a href="http://www.helcom.fi/helcom-at-work/projects/holas-ii" target="_blank">HOLAS II</a> project. The assessment can be applied with a focus on pressures only by using the Baltic Sea Pressure Index (BSPI) which shows the anthropogenic pressures/human activities in the defined assessment units without including ecosystem components. The BSPI however includes a weighting component in order to grade the effect of the pressures on the ecosystem in a generalized perspective. Cumulative impacts are calculated for each assessment unit (1 km2 grid cells) by summing all impacts occurring in the unit. All datasets and methodologies used in the index calculations are approved by all HELCOM Contracting Parties in review and acceptance processes. This dataset covers the time period 2011-2016. Please scroll down to "Lineage" and visit <a href="http://stateofthebalticsea.helcom.fi/cumulative-impacts/" target="_blank">State of the Baltic Sea website</a> for more info.
-

The database consists of three components: "Published age determination”, ”Published Sm-Nd isotope data" and "Pb isotope data on galena". The "Published age determination" database is based on age determinations, which comprise predominantly U-Pb zircon data produced at the Geological Survey of Finland since 1960’s. For igneous rocks the age register contains radiometric ages mostly interpreted as primary ages. The information given consists of location data, rock type, method, mineral analyzed, age results, comments and references. "Published Sm-Nd isotope data" comprise Sm-Nd data procuded at GTK since 1981, which mostly are used to constrain the origin of crust. "Pb isotope data on galena" gives results produced at GTK since 1970's, and include also previously unpublished data.
-

NLS-FI INSPIRE View Service for Administrative Units Theme is an INSPIRE compliant Web Map Service. It contains the following harmonized INSPIRE map layers: AdministrativeUnit, AdministrativeBoundary, Baseline, TerritorialSea, ExclusiveEconomicZone, MaritimeBoundary.InternalWaters, MaritimeBoundary.TerritorialSea ,MaritimeBoundary.ExclusiveEconomicZone. The service is based on the NLS-FI INSPIRE Administrative Units dataset. The dataset is administrated by the National Land Survey of Finland.
-
This dataset represents the Integrated biodiversity status assessment for fish used in State of the Baltic Sea – Second HELCOM holistic assessment 2011-2016. Status is shown in five categories based on the integrated assessment scores obtained in the BEAT tool. Biological Quality ratios (BQR) above 0.6 correspond to good status. The assessment is based on core indicators of coastal fish in coastal areas, and on internationally assessed commercial fish in the open sea. The open sea assessment includes fishing mortality and spawning stock biomass as an average over 2011–2016. Open sea results are given by ICES subdivisions, and are not shown where they overlap with coastal areas. Coastal areas results are given in HELCOM Assessment unit Scale 3 (Division of the Baltic Sea into 17 sub-basins and further division into coastal and off-shore areas) Attribute information: "COUNTRY" = name of the country / opensea "Name" = Name of the coastal assessment unit, scale 3 (empty for ICES open sea units) "HELCOM_ID" = ID of the HELCOM scale 3 assessment unit (empty for ICES open sea units) "EcoystemC" = Ecosystem component analyzed "BQR" = Biological Quality Ratio "Conf" = Confidence (0-1, higher values mean higher confidence) "Total_indi" = Number of HELCOM core indicators included (coastal assessment units) "F__of_area = % of area assessed "D1C2" = MSFD descriptor 1 criteria 2 "Number_of" = Number of open sea species included "Confidence" = Confidence of the assessment "BQR_Demer" = Demersal Biological Quality Ratio "F_spec_Deme" = Number of demersal species included "Conf_Demer" = Confidence for demersal species "BQR_Pelagi" = Pelagic Biological Quality Ratio "F_specPela" = Number of pelagic species included "Conf_Pelag" = Confidence for pelagic species "ICES_SD" = ICES Subdivision number "STATUS" = Integrated status category (0-0.2 = not good (lowest score), 0.2-0.4 = not good (lower score), 0.4-0.6 = not good (low score), 0.6-0.8 = good (high score, 0.8-1.0 = good (highest score))
-
KUVAUS: Osana Tampereen kaupungin luonnon monimuotoisuusohjelman päivitystä toteutettiin loka-marraskuussa 2024 kysely paikallisille luonto- ja ympäristöjärjestöille sekä lumo-asiantuntijoille. Kysely oli avoinna 31.10.-1.12.2024 ja se toteutettiin Fiilis-karttakyselytyökalulla. Kysymykset valmisteltiin Tampereen kaupungin ilmasto- ja ympäristöpolitiikan yksikössä. Kysely lähetettiin 18 yhdistykselle, joista 6 yhdistystä vastasi kyselyyn: Tampereen hyönteistutkijain seura ry, Tampereen 4H-yhdistys, Luontoliiton Hämeen piiri (Tampereen metsäryhmä), Suomen luonnonsuojeluliitto Pirkanmaan piiri ry, Pirkanmaan lintutieteellinen yhdistys, 1 muu, jonka nimi puuttui (johtui kyselyohjelman teknisestä häiriöstä). Kysely lähetettiin myös 25 paikalliselle asiantuntijalle, kuten tutkijoille, viheralan yrittäjille, naapurikuntien ympäristönsuojelun asiantuntijoille sekä muille kuin Tampereen kaupungin viranomaisille, joiden työ liittyy luonnon monimuotoisuuteen. 10 asiantuntijatahoa vastasi kyselyyn. KATTAVUUS: Tampere YLLÄPITO: Kyseessä on poikkileikkausaineisto (Aineisto ei päivity). KOORDINAATTIJÄRJESTELMÄ: Aineisto tallennetaan ETRS-GK24 (EPSG:3878) tasokoordinaattijärjestelmässä. GEOMETRIA: vektori (pisteitä ja alueita) SAATAVUUS: Aineisto on katsottavissa kirjautuneille käyttäjille Oskari-karttapalvelussa. AINEISTOSTA VASTAAVA TAHO: Tampereen kaupunki, Ilmasto- ja ympäristöpolitiikan yksikkö
 Paikkatietohakemisto