 Paikkatietohakemisto
series
Type of resources
Available actions
Topics
Keywords
Contact for the resource
Provided by
Years
Formats
Representation types
Update frequencies
status
Scale
Resolution
-
The Finnish Forest Research Institute (Metla) developed a method called multi-source national forest inventory (MS-NFI). The first operative results were calculated in 1990. The first country level estimates correspond to years 1990-1994. Small area forest resource estimates, in here municipality level estimates, and estimates of variables in map form are calculated using field data from the Finnish national forest inventory, satellite images and other digital georeferenced data, such as topographic database of the National Land Survey of Finland. Nine sets of estimates have been produced for the most part of the country until now and eight sets for Lapland. These three themes have been produced for production of the CORINE2006. The products cover the combined land categories forest land, poorly productive forest land and unproductive land. The other land categories as well as water bodies have been delineated out using the elements of the topographic database of the Land Survey of Finland. The original map data can be downloaded from http://kartta.luke.fi/
-
The Finnish Forest Research Institute (Metla) developed a method called multi-source national forest inventory (MS-NFI). The first operative results were calculated in 1990. Small area forest resource estimates, in here municipality level estimates, and estimates of variables in map form are calculated using field data from the Finnish national forest inventory, satellite images and other digital georeferenced data, such as topographic database of the National Land Survey of Finland. Six sets of estimates have been produced for the most part of the country until now and five sets for Lapland. The number of the map form themes in the most recent version, from year 2011, is 45. In addition to the volumes by tree species and timber assortments, the biomass by tree species groups and tree compartments have been estimated. The first country level estimates correspond to years 1990-1994. The most recent versions are from years 2005, 2007, 2009 and 2011. The maps from 2011 is the second set of products freely available. The new set of the products will be produced annually or biannually in the future. The maps are in a raster format with a pixel size of 20mx20m and in the ETRS-TM35FIN coordinate system. The products cover the combined land categories forest land, poorly productive forest land and unproductive land. The other land categories as well as water bodies have been delineated out using the elements of topographic database of the Land Survey of Finland.
-
The data set relating to overall mapping of national peat resources contains by focus area those mires over 20 ha in extent that are most important from a peat production perspective. Since 1975 additional smaller areas have been included as required. For each mire, there are data on mire type, peat type, peat reserves, peat physical properties, mires that are suitable for peat production, peat quality and exploitable peat reserves. This information is published in municipality-specific peat investigation reports that present general information on each mire investigated and their applicability to energy, horticultural and environmental peat production as well as to protection purposes, among other uses.
-
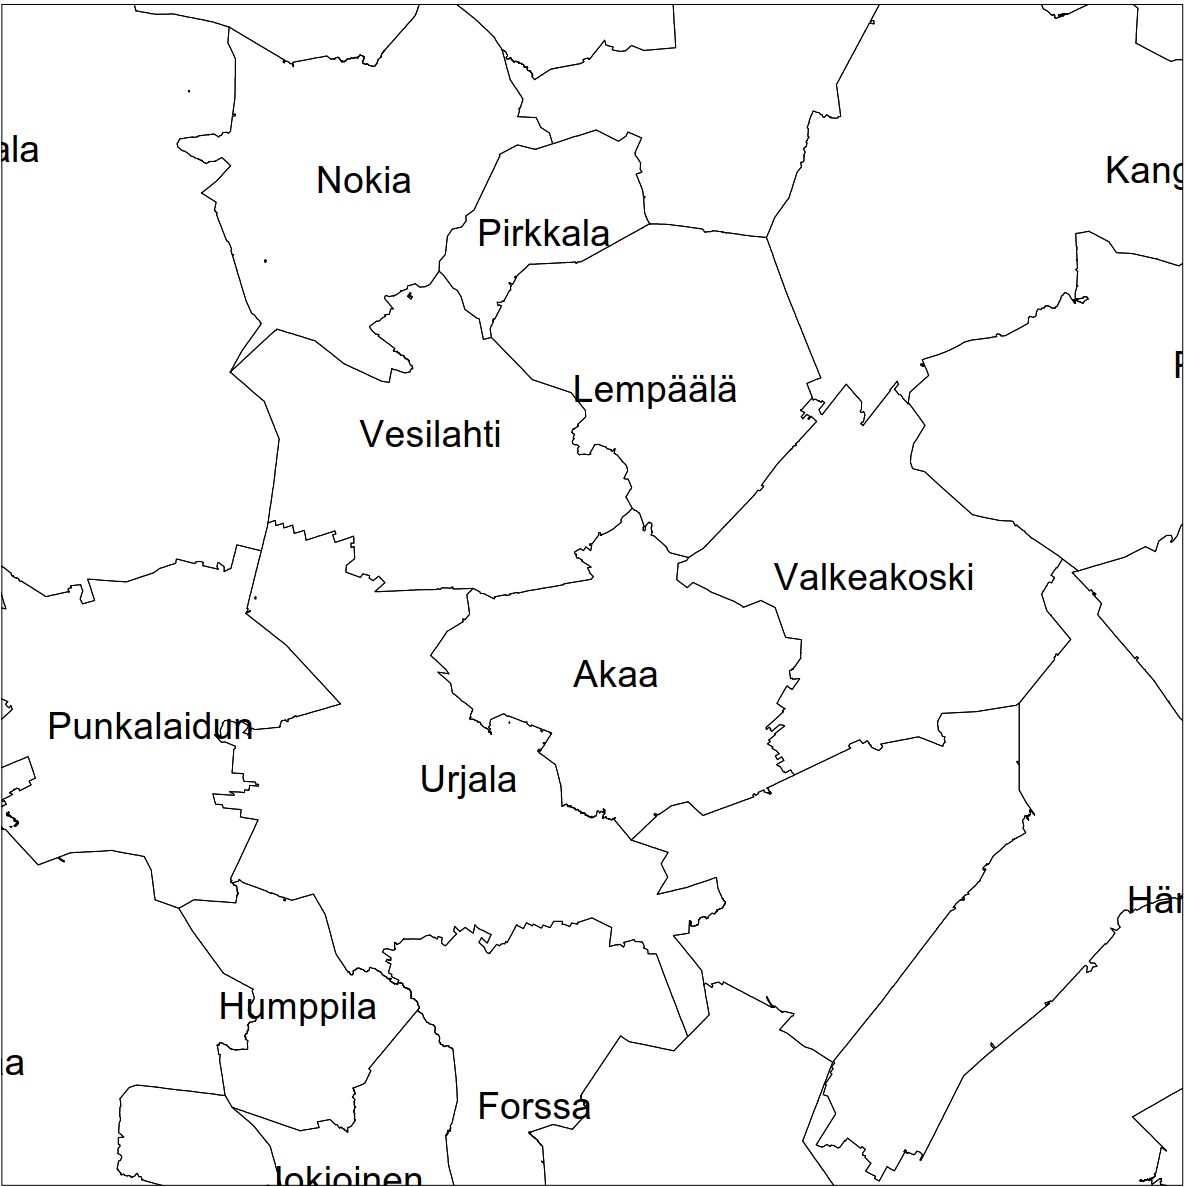
Division into administrative areas (raster) is a dataset depicting the municipal Division of Finland. The dataset Municipal Division is produced in scales 1:10,000, 1:100,000, 1:250,000, 1:1,000,000 and 1:4,500,000. The data included in the dataset in scale 1:10,000 are taken from the Cadastre. Regarding other scales, municipal boundaries have been generalised to suit the scale in question. Division into administrative areas products in raster format include municipal boundaries only. The product is a part of the open data of the National Land Survey.
-
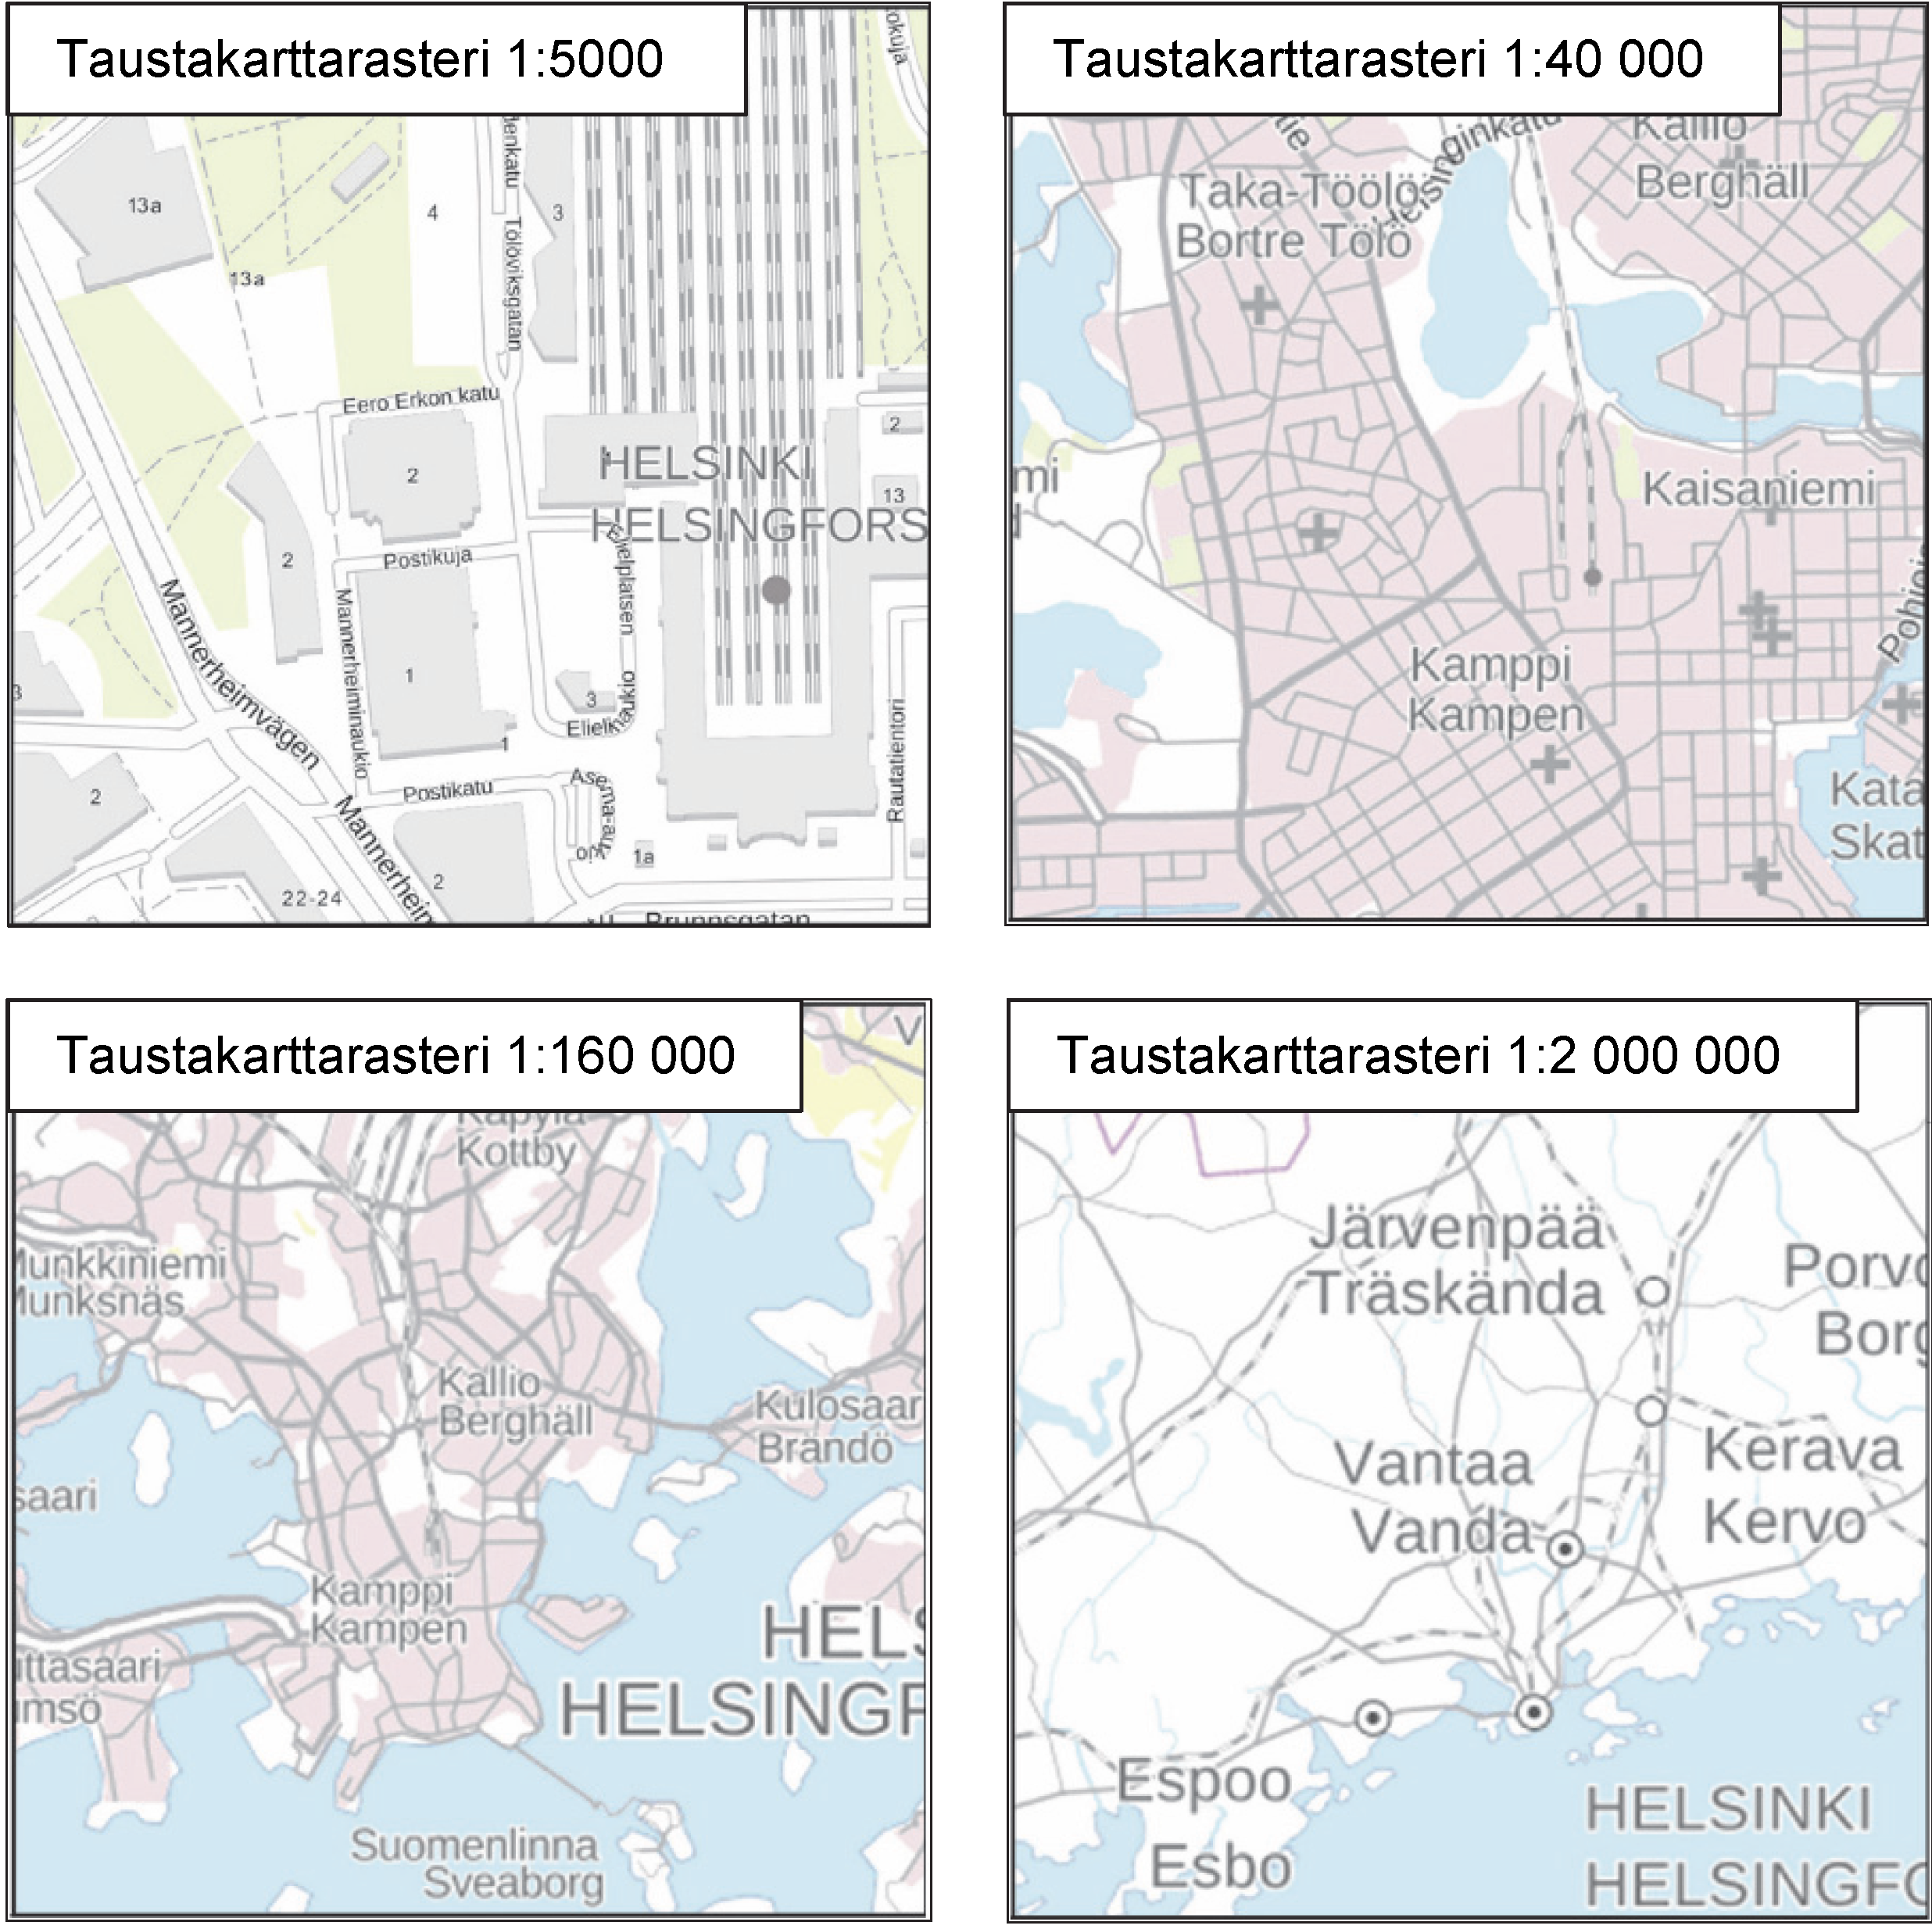
The Background map is a dataset product series in raster format that depicts the whole of Finland and that is meant for web use as a background material for thematic data. Its key objects are road names, roads and railways, buildings and constructions, administrative borders, geographical names, waterways, land use and addresses of buildings (from Ryhti/Finnish Environment Institute). The product belongs to the open data of the National Land Survey of Finland.
-
The raw materials of forest chips in Biomass Atlas are small-diameter trees from first thinning fellings and logging residues and stumps from final fellings. The harvesting potential consists of biomass that would be available after technical and economic constraints. Such constraints include, e.g., minimum removal of energywood per hectare, site fertility and recovery rate. Note that the techno-economic potential is usually higher than the actual availability, which depends on forest owners’ willingness to sell and competitive situation. The harvesting potentials were estimated using the sample plots of the 11th and 12th national forest inventory (NFI11 and NFI12) measured in the years 2013–2017. First, a large number of sound and sustainable management schedules for five consecutive ten-year periods were simulated for each sample plot using a large-scale Finnish forest planning system known as MELA (Siitonen et al. 1996; Hirvelä et al. 2017). MELA simulations consisted of natural processes and human actions. The ingrowth, growth, and mortality of trees were predicted based on a set of distance-independent tree-level statistical models (e.g. Hynynen et al. 2002) included in MELA and the simulation of the stand (sample plot)-level management actions was based on the current Finnish silvicultural guidelines (Äijälä et al. 2014) and the guidelines for harvesting of energy wood (Koistinen et al. 2016). Future potentials were assumed to materialize when the industrial roundwood fellings followed the level of maximum sustainable removals (80.7 mill. m3 in this calculation). The maximum sustainable removals were defined such that the net present value calculated with a 4% discount rate was maximized subject to non-declining periodic industrial roundwood and energy wood removals and net incomes, and subject to the saw log removal remaining at least at the level of the first period. There were no constraints concerning tree species selection, cutting methods, age classes, or the growth/drain ratio in order to efficiently utilize the dynamics of forest structure. The potential for energywood from first thinnings was calculated separately for all the wood from first thinnings (Small-diameter trees from first thinnings) and for material that does not fulfill the size-requirements for pulpwood (Small-diameter trees from first thinnings, smaller than pulpwood). The minimum top diameter of pulpwood in the calculation was 6.3 cm for pine (Pinus sylvestris) and 6.5 cm for spruce (Picea abies) and broadleaved species (mainly Betula pendula, B. pubescens, Populus tremula, Alnus incana, A. glutinosa and Salix spp.). The minimum length of a pulpwood log was assumed at 2.0 m. The potentials do not include branches. The potentials for logging residues and stumps were calculated as follows: The biomass removals of clear fellings were obtained from MELA. According to harvesting guidelines for energywood (Koistinen et al. 2016) mineral soils classified as sub-xeric (or weaker) and peatlands with corresponding low nutrient levels were left out from the potentials. Finally, technical recovery rates were applied (70% for logging residues and 82-84% for stumps) (Koistinen et al. 2016; Muinonen et al. 2013) The techno-economical harvesting potentials were first calculated for nineteen Finnish regions and then distributed on a raster grid at 1 km × 1 km resolution by weighting with Multi-Source NFI biomasses as described by Anttila et al. (2018). The potentials represent time period 2025-2034 and are presented as average annual potentials in solid cubic metres over bark. References Äijälä O, Koistinen A, Sved J, Vanhatalo K, Väisänen P. 2014. Metsänhoidon suositukset. [Guidelines for sustainable forest management]. Metsätalouden kehittämiskeskus Tapion julkaisuja. Anttila P., Nivala V., Salminen O., Hurskainen M., Kärki J., Lindroos T.J. & Asikainen A. 2018. Regional balance of forest chip supply and demand in Finland in 2030. Silva Fennica vol. 52 no. 2 article id 9902. 20 s. https://doi.org/10.14214/sf.9902 Hirvelä, H., Härkönen, K., Lempinen, R., Salminen, O. 2017. MELA2016 Reference Manual. Natural Resources Institute Finland (Luke). 547 p. Hynynen J, Ojansuu R, Hökkä H, Salminen H, Siipilehto J, Haapala P. 2002. Models for predicting the stand development – description of biological processes in MELA system. The Finnish Forest Research Institute Research Papers. 835. Koistinen A, Luiro J, Vanhatalo K. 2016. Metsänhoidon suositukset energiapuun korjuuseen, työopas. [Guidelines for sustainable harvesting of energy wood]. Tapion julkaisuja. Muinonen E., Anttila P., Heinonen J., Mustonen J. 2013. Estimating the bioenergy potential of forest chips from final fellings in Central Finland based on biomass maps and spatially explicit constraints. Silva Fennica 47(4) article 1022. https://doi.org/10.14214/sf.1022. Siitonen M, Härkönen K, Hirvelä H, Jämsä J, Kilpeläinen H, Salminen O et al. 1996. MELA Handbook. 622. 951-40-1543-6.
-
The Finnish Forest Research Institute (Metla) developed a method called multi-source national forest inventory (MS-NFI). The first operative results were calculated in 1990. Small area forest resource estimates, in here municipality level estimates, and estimates of variables in map form are calculated using field data from the Finnish national forest inventory, satellite images and other digital georeferenced data, such as topographic database of the National Land Survey of Finland. Nine sets of estimates have been produced for the most part of the country until now and eight sets for Lapland. The number of the map form themes in the most recent version, from year 2019, is 45. In addition to the volumes by tree species and timber assortments, the biomass by tree species groups and tree compartments have been estimated. The first country level estimates correspond to years 1990-1994. The most recent versions are from years 2005, 2007, 2009, 2011, 2013, 2015, 2017 and 2019. The maps from 2019 is the fifth set of products freely available. It is also the fourth set produced by the Natural Resources Institute Finland. A new set of the products will be produced annually or biannually in the future. The maps are in a raster format with a pixel size of 16m x 16m (from 2013) and in the ETRS-TM35FIN coordinate system. The products cover the combined land categories forest land, poorly productive forest land and unproductive land. The other land categories as well as water bodies have been delineated out using the elements of the topographic database of the Land Survey of Finland.
-

Division into administrative areas (vector) is a dataset depicting the municipalities, regions, Economic development centres and the national border of Finland. The Division into administrative areas products in vector format contain the number codes of the municipalities, the names of the municipalities in both Finnish and Swedish as well as municipal boundaries and municipal geographical areas. In addition, the products include the corresponding information about the regions, the Economic development centres and the nation as well as a specification of the municipality's area into land and water area. The municipality's area is not included in the XML/GML and GeoPackage format. The dataset Municipal Division is produced in scales 1:10,000, 1:100,000, 1:250,000, 1:1,000,000 and 1:4,500,000. The data included in the dataset in scale 1:10,000 are taken from the Cadastre. Regarding other scales, municipal boundaries have been generalised to suit the scale in question. The product is a part of the open data of the National Land Survey.
-
The Finnish Forest Research Institute (Metla) developed a method called multi-source national forest inventory (MS-NFI). The first operative results were calculated in 1990. Small area forest resource estimates, in here municipality level estimates, and estimates of variables in map form are calculated using field data from the Finnish national forest inventory, satellite images and other digital georeferenced data, such as topographic database of the National Land Survey of Finland. Seven sets of estimates have been produced for the most part of the country until now and six sets for Lapland. The number of the map form themes in the most recent version, from year 2015, is 45. In addition to the volumes by tree species and timber assortments, the biomass by tree species groups and tree compartments have been estimated. The first country level estimates correspond to years 1990-1994. The most recent versions are from years 2005, 2007, 2009, 2011, 2013 and 2015. The maps from 2015 is the fourth set of products freely available. It is also the second set produced by the Natural Resources Institute Finland. A new set of the products will be produced annually or biannually in the future. The maps are in a raster format with a pixel size of 16m x 16m (from 2013) and in the ETRS-TM35FIN coordinate system. The products cover the combined land categories forest land, poorly productive forest land and unproductive land. The other land categories as well as water bodies have been delineated out using the elements of the topographic database of the Land Survey of Finland.
-
The Regional Stream Sediment Geochemical Mapping data set gives information on the elemental concentrations in organic sediments of small headwater streams. The samples have been taken from small headwater streams (catchment area under 30 km2) in the late summer of 1990. Sampling has been repeated for about every fourth point during the years 1995, 2000 and 2006. The number of samples was 1162 in 1990 (at a density of one sample / 300 km2), 286 in 1995, 286 in 2000 and 249 in 2006. The data set covers the whole of Finland. Stream water samples have also been taken at the same time. Sampling, processing and analysis methods have been described in the Geochemical Atlas of Finland, Part 3, p. 27 - 30 (Lahermo et. al 1996). Field observations, coordinates and element concentrations determined from samples have been made into a database, in which each record represents one sample point. The data for each sampling year have been recorded on different tables. The method of analysis is referred to with a four-character method code. The codes are as follows: 503H = mercury determination using the cold vapour method 503P = nitric acid extraction in a microwave oven, measurement with ICP-AES 503M = nitric acid extraction in a microwave oven, measurement with ICP-MS 820L = carbon, hydrogen and nitrogen determination with a LECO analyser. The element concentration data include a numerical concentration value (as mg kg-1 or ppm) and possibly a check mark. The concentration is recorded as a variable, which has a name that comprises the chemical symbol for the element and the code for the method of analysis. For example AS_503M is arsenic (As) concentration, which is determined with the ICP-MS method (503M). The next variable has a check mark, for example AS_503MT. If the numerical value following the check mark is ‘>’ or '‘<’ then the number recorded in the concentration field is the determination limit of the chemical analytical method used and the actual concentration is less than this value. If the check mark is an exclamation mark (!), the analytical result is smaller than the determination limit of the analytical method use but the (unreliable) value obtained with the measuring instrument has been entered in the database. There is no data are if the check mark is a 'x'. The original purpose of the Regional Stream Water Geochemical Mapping data set was national general geochemical mapping and the basic assessment of environmental state. Other uses are, for example, the assessment of changes in environmental state and determination of the baseline concentrations of surface water as part of the evaluation of the chemical state of catchment areas in accordance with the Water Framework Directive of the EU. The original purpose of the Regional Stream Water Geochemical Mapping data set was national general geochemical mapping and the basic assessment of environmental state. Other uses are, for example, the assessment of changes in environmental state and determination of the baseline concentrations of surface water as part of the evaluation of the chemical state of catchment areas in accordance with the Water Framework Directive of the EU.