 Paikkatietohakemisto
dataset
Type of resources
Available actions
Topics
Keywords
Contact for the resource
Provided by
Years
Formats
Representation types
Update frequencies
status
Service types
Scale
Resolution
-
The Baltic Sea Impact Index is an assessment component that describes the potential cumulative burden on the environment in different parts of the Baltic Sea. The BSII is based on georeferenced datasets of human activities (36 datasets), pressures (18 datasets) and ecosystem components (36 datasets), and on sensitivity estimates of ecosystem components (so-called sensitivity scores) that combine the pressure and ecosystem component layers, created in <a href="http://www.helcom.fi/helcom-at-work/projects/holas-ii" target="_blank">HOLAS II</a> project. Cumulative impacts are calculated for each assessment unit (1 km2 grid cells) by summing all pressures occurring in the unit for each ecosystem component. Highest impacts are found from the cells where both are abundant, but high impacts can be caused also by a single pressure if there are diverse and sensitive habitats in the grid cell. All data sets and methodologies used in the index calculations are approved by all HELCOM Contracting Parties in review and acceptance processes. This data set covers the time period 2011-2016. Please scroll down to "Lineage" and visit <a href="http://stateofthebalticsea.helcom.fi/cumulative-impacts/" target="_blank">State of the Baltic Sea website</a> for more info.
-
The technical harvesting potential of small-diameter trees can be defined as the maximum potential procurement volume of small-diameter trees available from the Finnish forests based on the prevailing guidelines for harvesting of energy wood. The potentials of small-diameter trees from early thinnings have been calculated for fifteen NUTS3-based Finnish regions covering the whole country (Koljonen et al. 2017). To begin with the estimation of the region-level potentials, technical harvesting potentials were estimated using the sample plots of the eleventh national forest inventory (NFI11) measured in the years 2009–2013. First, a large number of sound and sustainable management schedules for five consecutive ten-year periods were simulated for each sample plot using a large-scale Finnish forest planning system known as MELA (Siitonen et al. 1996; Redsven et al. 2013). MELA simulations consisted of natural processes and human actions. The ingrowth, growth, and mortality of trees were predicted based on a set of distance-independent tree-level statistical models (e.g. Hynynen et al. 2002) included in MELA and the simulation of the stand (sample plot)-level management actions was based on the current Finnish silvicultural guidelines (Äijälä et al. 2014) and the guidelines for harvesting of energy wood (Koistinen et al. 2016). Simulated management actions for the small-tree fraction consisted of thinnings that fulfilled the following stand criteria: • mean diameter at breast height ≥ 8 cm • number of stems ≥ 1500 ha-1 • mean height < 10.5 m (in Lapland) or mean height < 12.5 m (elsewhere). Energy wood was harvested as delimbed (i.e. including the stem only) in spruce-dominated stands and peatlands and as whole trees (i.e. including stem and branches) elsewhere. When harvested as whole trees, a total of 30% of the original crown biomass was left onsite (Koistinen et al. 2016). Energy wood thinnings could be integrated with roundwood logging or carried out independently. Second, the technical energy wood potential of small trees was operationalized in MELA by maximizing the removal of thinnings in the first period. In this way, it was possible to pick out all small tree fellings simulated in the first period despite, for example, the profitability of the operation. However, a single logging event was rejected if the energy wood removal was lower than 25 m³ha-1 or the industrial roundwood removal of pine, spruce, or birch exceeded 45 m³ha-1. The potential calculated in this way contained also timber suitable for industrial roundwood. Therefore, two estimates are given: • potential of trees below 10.5 cm in breast-height diameter • potential of trees below 14.5 cm in breast-height diameter. Subsequently, the region-level potentials were spread on a raster grid at 1 km × 1 km resolution. Only grid cells on Forests Available for Wood Supply (FAWS) were considered in this operation. In this study, FAWS was defined as follows: First, forest land was extracted from the Finnish Multi-Source National Forest Inventory (MS-NFI) 2013 data (Mäkisara et al. 2016). Second, restricted areas were excluded from forest land. The restricted areas consisted of nationally protected areas (e.g. nature parks, national parks, protection programme areas) and areas protected by the State Forest Enterprise. In addition, some areas in northernmost Lapland restricted by separate agreements between the State Forest Enterprise and stakeholders were left out from the final data. Furthermore, for small trees, FAWS was further constrained by the stand criteria presented above to represent similar stand conditions for small-tree harvesting as in MELA. Finally, the region-level potentials were distributed to the grid cells by weighting with MS-NFI stem wood biomasses. References Äijälä O, Koistinen A, Sved J, Vanhatalo K, Väisänen P (2014) Metsänhoidon suositukset [Guidelines for sustainable forest management]. Metsätalouden kehittämiskeskus Tapion julkaisuja. Hynynen J, Ojansuu R, Hökkä H, Salminen H, Siipilehto J, Haapala P (2002) Models for predicting the stand development – description of biological processes in MELA system. The Finnish Forest Research Institute Research Papers 835. Koistinen A, Luiro J, Vanhatalo K (2016) Metsänhoidon suositukset energiapuun korjuuseen, työopas [Guidelines for sustainable harvesting of energy wood]. Metsäkustannus Oy, Helsinki. Koljonen T, Soimakallio S, Asikainen A, Lanki T, Anttila P, Hildén M, Honkatukia J, Karvosenoja N, Lehtilä A, Lehtonen H, Lindroos TJ, Regina K, Salminen O, Savolahti M, Siljander R (2017) Energia ja ilmastostrategian vaikutusarviot: Yhteenvetoraportti. [Impact assessments of the Energy and Climate strategy: The summary report.] Publications of the Government´s analysis, assessment and research activities 21/2017. Mäkisara K, Katila M, Peräsaari J, Tomppo E (2016) The Multi-Source National Forest Inventory of Finland – methods and results 2013. Natural resources and bioeconomy studies 10/2016. Redsven V, Hirvelä H, Härkönen K, Salminen O, Siitonen M (2013) MELA2012 Reference Manual. Finnish Forest Research Institute. Siitonen M, Härkönen K, Hirvelä H, Jämsä J, Kilpeläinen H, Salminen O, Teuri M (1996) MELA Handbook. Metsäntutkimuslaitoksen tiedonantoja 622. ISBN 951-40-1543-6.
-
-
-
KUVAUS: Tampereen rakennelmien 2D-seinälinjat aluemuotoisena geometriana korkeudeltaan nollattuna. Mukana vain valmiit ja julkisesti näytettävät rakennelmat. Virkistys aamuisin klo 6.35. KATTAVUUS: Tampereen kaupunkiseutu PÄIVITYS: Aineistoa päivitetään jatkuvasti uusien rakennelmien valmistuessa. YLLÄPITOSOVELLUS: StellaMap (DGN-tiedostot) ja FME KOORDINAATTIJÄRJESTELMÄ: Aineisto tallennetaan ETRS-GK24FIN (EPSG:3878) tasokoordinaattijärjestelmässä. GEOMETRIA: vektori (alue) SAATAVUUS: Aineisto on saatavilla WFS-rajapinnalta Tampereen kaupungin sisäiseen käyttöön sekä konsulteille sopimuksella/käyttöehdolla. Aineiston primäärilähde on Oracle-tietokanta. JULKISUUS: Aineisto on julkisesti katsottavissa Oskari-karttapalvelussa. TIETOSUOJA: Aineistoon ei liity tietosuojakysymyksiä. KENTÄT: -TYYPPI: Rakennelma, Muu rakennelma, Portaat tai esteettömyysluiska, Laituri, Piippu tai Allas -ALALUOKKA: Varastotila, Katos, Muu rakennelma, Maastoportaat, Autokatos, Joukkoliikenteen pysäkkikatos, Muu laituri, Venelaituri, Mainosrakennelma, Jätekatos, Muistomerkki, Savupiippu, Huvipuistolaite, Raunio, Katsomo, Muu piippu, Maatalousallas, Maauima-allas, Esteettömyysluiska, Hyppyrimäki, Keittokatos, Suihkulähde tai suihkukaivo -RAKENNELMALUOKKA_FACTA: Tulee rakennelmalle i_pyraknro perusteella Factasta (huom. ei löydy kaikilta rakennelmilta). -PYSYVA_RAK_NRO_FACTA: Rakennelman pysyvä rakennusnumero Factasta. AINEISTOSTA VASTAAVA TAHO: Tampereen kaupunki, Paikkatietoyksikkö, paikkatieto_tuki@tampere.fi
-
This dataset represents the integrated assessment of hazardous substances in the Baltic Sea in 2011-2016, assessed using the CHASE tool (https://github.com/helcomsecretariat/CHASE-integration-tool). The integration is based on hazardous substances core indicators covering concentrations of hazardous substances. This dataset displays the result of the assessment in HELCOM Assessment unit Level 3 (Division of the Baltic Sea into 17 sub-basins and further division into coastal and offshore areas). Attribute information: "HELCOM_ID" = ID of the HELCOM scale 3 assessment unit "country" = Country/ opensea "level_3" = Name of the HELCOM scale 3 assessment unit "area_km2 = Area of the HELCOM scale 3 assessment unit "AULEVEL" = Scale of the assessment units "coastal" = Code of scale 3 HELCOM assessment unit "Input" = Contamination ratio of the assessment unit (Higher score indicates higher contamination) "Confidence" = Confidence of the assessment (Low/ Moderate/ High/ Not assessed) "Status" = Status value for the assessment (= 1.0: Low contamination score, > 1.0: High contaminantion score)
-
The EMODnet (European Marine Observation and Data network) Geology project collects and harmonizes marine geological data from the European sea areas to support decision making and sustainable marine spatial planning. The partnership includes 39 marine organizations from 30 countries. The partners, mainly from the marine departments of the geological surveys of Europe (through the Association of European Geological Surveys-EuroGeoSurveys), have assembled marine geological information at various scales from all European sea areas (e.g. the White Sea, Baltic Sea, Barents Sea, the Iberian Coast, and the Mediterranean Sea within EU waters). This dataset includes EMODnet seabed substrate maps at a scale of 1:25 000 from the European marine areas. Traditionally, European countries have conducted their marine geological surveys according to their own national standards and classified substrates on the grounds of their national classification schemes. These national classifications are harmonised into a shared EMODnet schema using Folk's sediment triangle with a hierarchy of 16, 7 and 5 substrate classes. The data describes the seabed substrate from the uppermost 30 cm of the sediment column. Further information about the EMODnet Geology project is available on the portal (http://www.emodnet-geology.eu/).
-
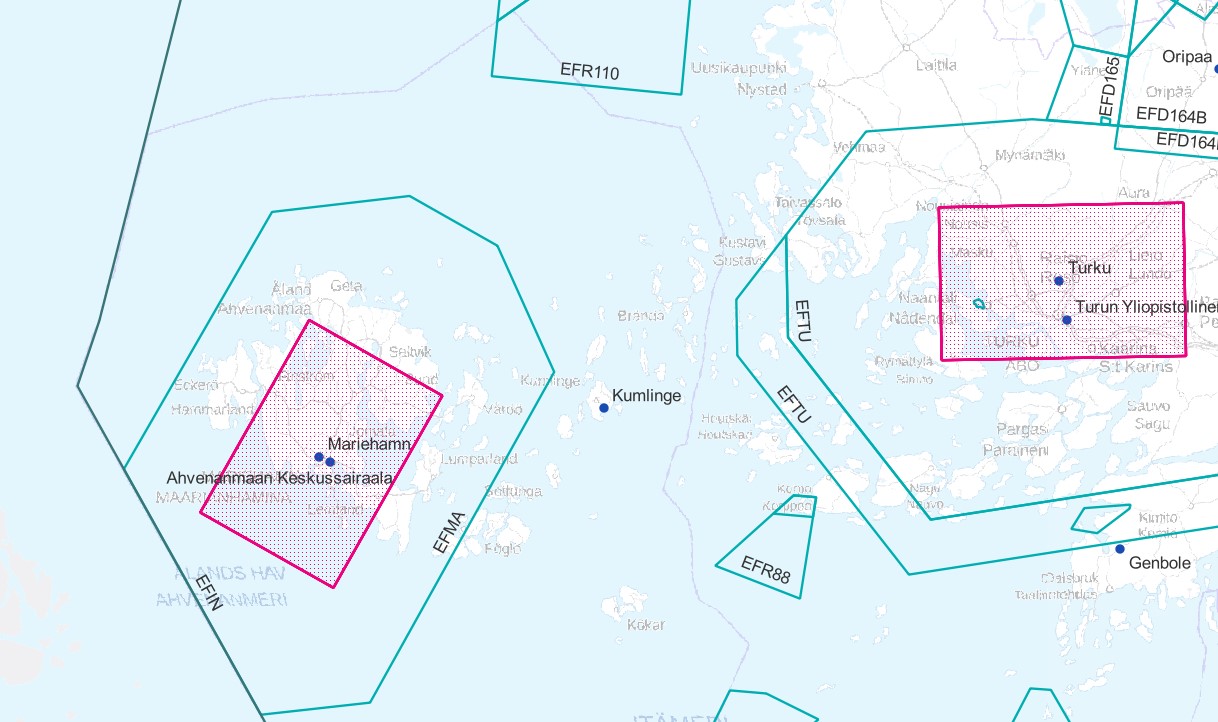
Air traffic network-product is a link-knot routing dataset compliant with INSPIRE requirements. It includes f.ex. flight routes and aerodromes. Data shall not be used for operational flight activities or flight planning. INSPIRE Air Traffic Network-product includes spatial information of air traffic network in accordance with the INSPIRE Directive. The data has been retrieved from the EAD database maintained by Eurocontrol. Information is updated regularly but is not constantly up to date. Data can be used for purposes that are in accordance with the INSPIRE Directive, but shall not be used for operational flight activities or flight planning. ANS Finland www.ais.fi –site provides information for operational flight activities or flight planning Available layers Aerodrome Node: Node located at the aerodrome reference point of an airport/heliport, which is used to represent it in a simplified way.DEFINITION Aerodrome Reference Point (ARP): The designated geographical location of an aerodrome, located near the initial or planned geometric centre of the aerodrome and normally remaining where originally established [AIXM3.3].DEFINITION Airport/heliport: A defined area on land or water (including any buildings, installations and equipment) intended to be used either wholly or in part for the arrival, departure and surface movement of aircraft/helicopters [AIXM5.0]. Air Route Link: A portion of a route to be flown usually without an intermediate stop, as defined by two consecutive significant points Air Space Area: A defined volume in the air, described as horizontal projection with vertical limits. Designated Point: A geographical location not marked by the site of a radio navigation aid, used in defining an ATS route, the flight path of an aircraft or for other navigation or ATS purposes. Instrument Approach Procedure: A series of predetermined manoeuvres by reference to flight instruments with specified protection from obstacles from the initial approach fix, or where applicable, from the beginning of a defined arrival route to a point from which a landing can be completed and thereafter, if a landing is not completed, to a position at which holding or en route obstacle clearance criteria apply. Navaid: One or more Navaid Equipments providing navigation services.DEFINITION Navaid equipment: A physical navaid equipment like VOR, DME, localizer, TACAN or etc. Procedure Link: A series of predetermined manoeuvres with specified protection from obstacles. Runway Area: A defined rectangular area on a land aerodrome/heliport prepared for the landing and take-off of aircraft. Runway Centerline Point: An operationally significant position on the center line of a runway direction. Standard Instrument Arrival: A designated instrument flight rule (IFR) arrival route linking a significant point, normally on an ATS route, with a point from which a published instrument approach procedure can be commenced. Standard Instrument Departure: A designated instrument flight rule (IFR) departure route linking the aerodrome or a specific runway of the aerodrome with a specified significant point, normally on a designated ATS route, at which the en-route phase of a flight commences. Surface Composition: Runway surface material CTR (Not INSPIRE): A control zone (CTR) is a block of Controlled Airspace extending from the surface of the earth to a specified upper limit.
-
Maanmittauslaitoksen KM2-korkeusmallin kanssa yhteensopiva korkeusmalli, jossa alkuperäisiä korkeusarvoja on alennettu erityisesti virtavesikohteiden (viivamaiset sekä aluemaiset) ja tieverkoston risteyskohdissa. Alennetut korkeusarvot pyrkivät kuvaamaan virtausreittejä, kuten tierumpuja ja putkia, joita alkuperäisessä KM2:ssa ei ole. Aineisto on tuotettu yhdistämällä useita eri valtakunnan kattavia lähtöaineistoja, joita ovat - korkeusmalli KM2 (Maanmittauslaitos) - Siltojen kansien korkeudet (Syke) - Maastotietokanta (Maanmittauslaitos) - DIGIROAD-tieverkosto (Väylävirasto) - Rumpurekisteri (Väylävirasto) Lisäksi jotkin kunnat ja kaupungit ovat digitoineet Maastotietokannasta puuttuvia virtausreittejä. Korkeusarvot ovat ilmoitettu N2000-korkeusjärjestelmässä. Aineisto on avoin (lisenssi CC BY 4.0). Käyttötarkoitus: Korvaamalla KM2:n korkeusarvot uomakorjausaineiston arvoilla saadaan korkeusmalli, joka soveltuu mm. pintaveden virtauksen mallinnukseen alkuperäistä korkeusmallia paremmin. Tämä mahdollistaa esim. hulevesitulvariskien luotettavamman arvioinnin. Aineisto kuuluu SYKEn avoimiin aineistoihin (CC BY 4.0). Lähde: Syke, Maanmittauslaitos (perustuu Syken, MML:n ja Väyläviraston aineistoihin).
-
The EMODnet (European Marine Observation and Data network) Geology project collects and harmonizes marine geological data from the European sea areas to support decision making and sustainable marine spatial planning. The partnership includes 39 marine organizations from 30 countries. The partners, mainly from the marine departments of the geological surveys of Europe (through the Association of European Geological Surveys-EuroGeoSurveys), have assembled marine geological information at various scales from all European sea areas (e.g. the White Sea, Baltic Sea, Barents Sea, the Iberian Coast, and the Mediterranean Sea within EU waters). This dataset includes EMODnet seabed substrate maps at a scale of 1:5 000 from the European marine areas. Traditionally, European countries have conducted their marine geological surveys according to their own national standards and classified substrates on the grounds of their national classification schemes. These national classifications are harmonised into a shared EMODnet schema using Folk's sediment triangle with a hierarchy of 16, 7 and 5 substrate classes. The data describes the seabed substrate from the uppermost 30 cm of the sediment column. Further information about the EMODnet Geology project is available on the portal (http://www.emodnet-geology.eu/).