GeoTIFF
Type of resources
Available actions
Topics
Keywords
Contact for the resource
Provided by
Years
Formats
Representation types
Update frequencies
status
Service types
Scale
Resolution
-
This dataset represents the density of all IMO registered ships operating in the Baltic Sea. Density is defined as the number of ships crossing a 1 x 1km grid cell. It is based on HELCOM AIS (Automatic Identification System) data. The HELCOM AIS network hosts all the AIS signals received by the Baltic Sea States since 2005. The AIS Explorer allows to compare density maps of different ship types per month: http://maps.helcom.fi/website/AISexplorer/ The data was processed to produce density maps and traffic statistics. All scripts are available in GitHub: https://github.com/helcomsecretariat. The production of these maps have been carried out 2016-2017 through the HELCOM project on the assessment of maritime activities in the Baltic Sea. The underlying AIS data processing work has been co-financed by EU projects Baltic Scope (2015-2017 EASME/EMFF/2014/1.2.1.5) and Baltic Lines (2016-2019, Interreg Baltic Sea Region). In addition, the Ministry of the Environment of Finland supported the work with a special contribution in view of the use of the results in the HOLAS II process.
-

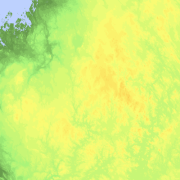
Elevation zones is a raster dataset that visualises elevation of the terrain. The product covers the whole of Finland. There are four product versions available in which the pixel sizes are 32, 64, 128 and 512 metres. The dataset does not contain elevation values; it is a colour image that visualises the height of the terrain above sea level as zones. The sea is shown in light blue in the elevation zone. The product Elevation zones is available as a version that covers the whole country and as versions that cover a certain area. The product belongs to the open data of the National Land Survey of Finland.
-
Aineisto on rasterikarttataso, joka on tuotettu lineaarisella regressiomallilla. Karttataso on tuotettu Turun alueelta ja Turun lisäksi edustettuna on jonkin verran lähikuntien alueita. Lämpösumma-aineistossa (Turku_lamposumma…) selitettävänä muuttujana on ollut yli 25 asteen rajan ylittävien astetuntien määrä. Selittävinä muuttujina ovat toimineet vesialueisiin, suhteelliseen korkeuteen ja kaupunkimaiseen maankäyttöön liittyvät muuttujat, joista osa on Avoindata.fi -alustalla omina aineistoinaan. Kunkin tilanteen mallintamisessa on käytetty ao. tilanteeseen sopivinta selittävän muuttujan vyöhykekokoa, joka on määritelty muuttujakohtaisesti korrelaatioanalyysin ja subjektiivisen, aihepiiriin liittyvän teoriataustaan pohjautuvan harkinnan perusteella. Lämpösumma-aineiston resoluutio on 250 m ja aineisto kattaa maa-alueet.
-
Kurikan opaskartta on digitaalinen karttatuote, joka on saatavissa julkisena palveluna kaupungin verkkosivujen kautta. Se kattaa Kurikan kunnan alueen. Opaskartassa kuvataan katuverkosto ja osoitenumerot sekä maastonimistöä, maankäyttöä ja rakennuksia ja niihin liittyvää tarkentavaa nimistöä. Karttatasoilla on myös myytävät tontit sekä ajantasaiset asemakaavat kaikkien kolmen taajaman osalta. Se toimii kaupungin osoitekarttana. Kartta skaalautuu portaattomasti siten, että se näyttää suuremmilla mittakaavatasoilla enemmän kohteita. Karttaa ylläpidetään jatkuvasti ja katuverkko ja osoitteisto on ajan tasalla. Kartasta voi tulostaa otteita. Vanhaa opaskarttaa on vielä saatavilla painettuna karttana. Uuden paperikartan painamisesta ei ole tehty päätöstä. Aineiston koordinaattijärjestelmä on ETRS-GK22. Korkeusjärjestelmä N2000.
-
Ajantasainen osoitteisto Laukaan kunnan alueelta. Osoitteet löytyvät opaskartalta, jota ylläpitää Laukaan kunnan alueelta Jyväskylän kaupunki. Ko. aineisto on saatavilla Jyväskylän WMS-palvelusta.
-

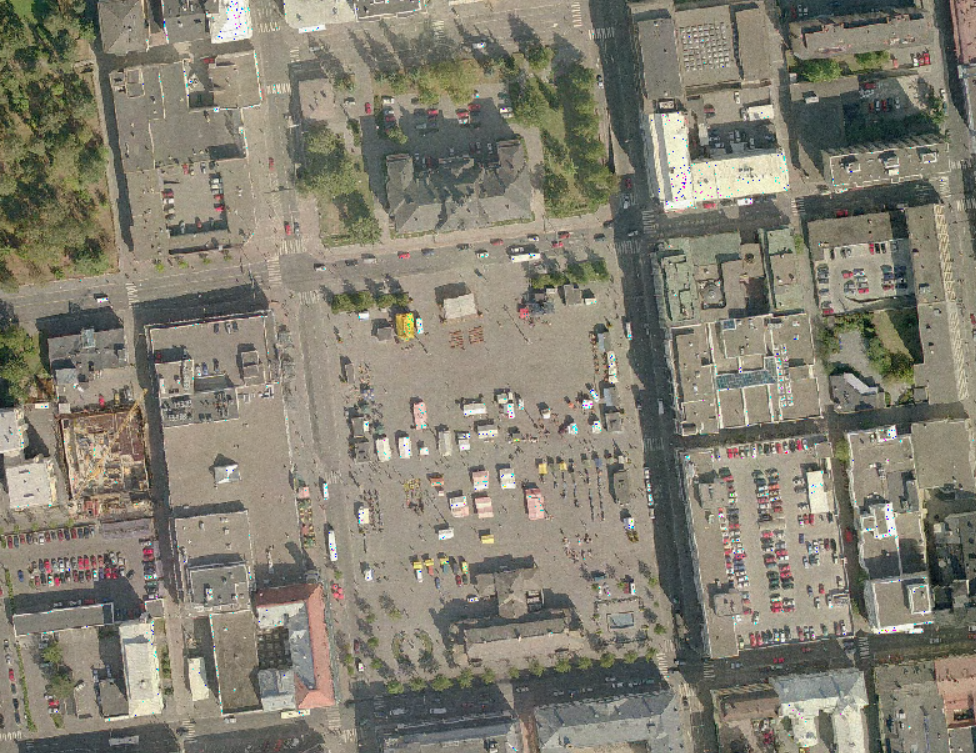
Ortokuva on lentokoneesta kohtisuoraan alaspäin otettu ilmakuva, josta on poistettu kameran kuvaprojektion ja maaston korkeusvaihteluiden aiheuttamat vääristymät. Ortokuvien yleinen maastopikselikoko eli maastoerottelukoko on 10 cm. Vanhimpien ilmakuvien maastoerottelokoko on välillä 10 cm ja 50 cm. Kuopion kaupungin tekemät ilmakuvaukset kattavat asemakaava-alueet. Vuoden 2006 ilmakuvaus on suoritettu 22.8.2006. Ilmakuvauksen suoritti Blomkartta Oy. Ortoilmakuvien maasterottelukyky on 10 cm. Ortokuva kattaa Kuopion keskustasta osan. Aineisto saatavissa ETRS-GK27 koordinaatistossa.
-
Aineisto sisältää Kuopion kaupungin kantakarttoja eri vuosikymmeniltä mm. vuosilta 2005, 2011 ja 2015. Kantakartoilla näkyvät tiedot eivät ole ajantasaisia, vaan kuvaavat ajanhetken tilannetta. Aineistoa on tuotettu maastomittauksella, stereotyöskentelyllä ja digitoimalla. Kuopion kaupungin ylläpitämä sijaintitarkka kaavan pohjakartta-aineisto (kantakartta) sisältää kiinteistöt, rakennukset, liikenneväylät, nimistöt, vesistöt, korkeustiedot, maapinnan, kasvillisuuden ja runkopisteet. Ennen 1.11.2012 tuotetuissa aineistoissa korkeusjärjestelmässä on useimmissa tapauksissa N43.
-

Lahden kaupungin Ortoilmakuva-aineistot eri vuosilta Ortoilmakuva on lentokoneesta kohtisuoraan alaspäin otettu ilmakuva, josta on poistettu kameran kuvaprojektion ja maaston korkeusvaihteluiden aiheuttamat vääristymät. Aineistojen maastoresoluutio on 10 - 5ocm. Aineiston koordinaatistojärjestelmä on ETRS-GK26 -koordinaatisto. Uusi Ortoilmakuva-aineisto tilataan 2-3 vuoden välein.
-
Ortoilmakuvat Hyvinkään alueelta. Ilmakuva kattaa koko Hyvinkään alueen. Kuvauspäivämäärä: 18-19.5.2014 Maastopikselikoko 0,10 - 0,25 m Tasokoordinaatisto: ETRS-GK-25 Korkeusjärjestelmä: N2000
-

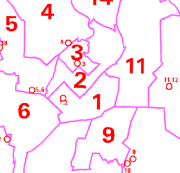
Jyväskylän kaupungin äänestysaluejako. Sisältää myös äänestyspaikat.
 Paikkatietohakemisto