 Paikkatietohakemisto
ESRI file gdb
Type of resources
Available actions
Topics
Keywords
Contact for the resource
Provided by
Years
Formats
Representation types
Update frequencies
status
Scale
-
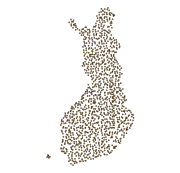
The Regional Stream Sediment Geochemical Mapping data set gives information on the elemental concentrations in organic sediments of small headwater streams. The samples have been taken from small headwater streams (catchment area under 30 km2) in the late summer of 1990. Sampling has been repeated for about every fourth point during the years 1995, 2000 and 2006. The number of samples was 1162 in 1990 (at a density of one sample / 300 km2), 286 in 1995, 286 in 2000 and 249 in 2006. The data set covers the whole of Finland. Stream water samples have also been taken at the same time. Sampling, processing and analysis methods have been described in the Geochemical Atlas of Finland, Part 3, p. 27 - 30 (Lahermo et. al 1996). Field observations, coordinates and element concentrations determined from samples have been made into a database, in which each record represents one sample point. The data for each sampling year have been recorded on different tables. The method of analysis is referred to with a four-character method code. The codes are as follows: 503H = mercury determination using the cold vapour method 503P = nitric acid extraction in a microwave oven, measurement with ICP-AES 503M = nitric acid extraction in a microwave oven, measurement with ICP-MS 820L = carbon, hydrogen and nitrogen determination with a LECO analyser. The element concentration data include a numerical concentration value (as mg kg-1 or ppm) and possibly a check mark. The concentration is recorded as a variable, which has a name that comprises the chemical symbol for the element and the code for the method of analysis. For example AS_503M is arsenic (As) concentration, which is determined with the ICP-MS method (503M). The next variable has a check mark, for example AS_503MT. If the numerical value following the check mark is ‘>’ or '‘<’ then the number recorded in the concentration field is the determination limit of the chemical analytical method used and the actual concentration is less than this value. If the check mark is an exclamation mark (!), the analytical result is smaller than the determination limit of the analytical method use but the (unreliable) value obtained with the measuring instrument has been entered in the database. There is no data are if the check mark is a 'x'. The original purpose of the Regional Stream Water Geochemical Mapping data set was national general geochemical mapping and the basic assessment of environmental state. Other uses are, for example, the assessment of changes in environmental state and determination of the baseline concentrations of surface water as part of the evaluation of the chemical state of catchment areas in accordance with the Water Framework Directive of the EU. The original purpose of the Regional Stream Water Geochemical Mapping data set was national general geochemical mapping and the basic assessment of environmental state. Other uses are, for example, the assessment of changes in environmental state and determination of the baseline concentrations of surface water as part of the evaluation of the chemical state of catchment areas in accordance with the Water Framework Directive of the EU.
-
The Superficial deposits of Finland 1:1 000 000 is based on 'Quaternary Deposits of Finland and Northwestern Part of Russian Federation and their Resources (Sheet 1, Western part)' mapping data. This data is also based on the 1984 map 'Quaternary Deposits of Finland' (1:1 000 000) in the “Geologia” (Geology) folio of the Atlas of Finland, 5th edition (123-126, 1990). Joint scientific and technical planning for the map of the 'Quaternary Deposits of Finland and Northwestern Part of Russian Federation and their Resources' was begun in 1987 while work on the map started in 1988. No field mapping was done for the map, rather the 1:1 000 000 Quaternary map printed in 1984 was supplemented with new data partly obtained from rock aggregate studies and partly from information on superficial deposits gathered in other superficial mapping projects. The map 'Quaternary Deposits of Finland and Northwestern Part of Russian Federation and their Resources' was printed in 1993. The map shows the superficial deposits with colours and symbols and these are classed according to their mode of geological development. The deposit classes are as follows: pre-Quaternary bedrock exposures (no Quaternary layers); boulder field, physically weathered bedrock; gravelly and sandy till; silty till; clayey till; hummocky moraine ; moraine complex; esker, delta, sandur, sorted marginal formation; interlobate formation (esker); till-covered esker / other till-covered gravel and sand deposit; gravel and sand deposit peripheral to eskers; littoral gravel and sand deposit; fluvial deposit; homogeneous clay and silt deposit; layered (varved) clay and silt deposit; peat deposit. Additionally, drumlins, end moraines, aeolian deposits, and sites of gravel, sand, clay and peat extraction as well as gold panning areas have been indicated with symbols. The data set was converted to a digital format to meet the needs of the OneGeology-Europe Project for a printed map in 2009. This data did not include drumlins, end moraines, aeolian deposits, and more important sites for the exploitation of superficial deposits (sites of gravel, sand, clay and peat extraction as well as gold panning areas). In accordance with the 1984 Quaternary map (1:1 000 000) the minimum size of the deposit polygon is generally one square kilometre. In nature the size of superficial sedimentary deposits is usually smaller than one square kilometre and therefore the most common deposit type in the area is shown in the polygon. In places, deposits smaller than a square kilometre that are significant from a superficial perspective have been noted. As a rule, the narrowest point of the deposit polygon was 0.5 km and in important cases, for example on eskers, 0.3 km. As an exception, the size of small eskers has been exaggerated. Coordinate reference system of the Superficial deposits of Finland 1:1 000 000 was transformed in October 2013. The transformation from Finnish National Grid Coordinate System (Kartastokoordinaattijärjestelmä, KKJ) Uniform Coordinate Frame to ETRS-TM35FIN projection was done by using the three-dimensional transformation in accordance with the recommendations for the public administration JHS154. The water layer which were used in the OneGeology-Europe project was replaced in 2015 with the more accurate water layer of the Topographic database 1:55 0000-1:500 000 (DVE3) from ICT Agency HALTIK.
-
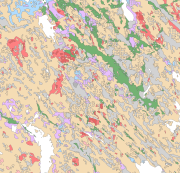
The Superficial deposits of Finland 1:200 000 (sediment polygons) contains data produced from the whole of Finland during the period 2002-2009. The data set can be used in regional planning, in military defence, in soil mapping (EU) and in joint mapping projects in various areas. The mapping scale has been 1:50 000-1:200 000. In compiling the medium-scale data set, generalised 1:20 000, 1:50 000 and 1:100 000 superficial deposits maps have been used and a new map product at a scale of 1:200 000 that is based on interpretation and field mapping. The minimum size of the sediment polygons is about six hectares. Exceptions are glaciofluvial, marginal till and hummocky moraine deposits, which are presented in the data set as areas with a surface area greater than two hectares. The blanketing peat overburden has been described in the new map product as a peat-covered area (0-0.3 m of peat), thin peat (0.3-0.6 m of peat) and thick peat (over 0.6 m of peat). Peat-covered areas, stone fields and uncovered bedrock areas have been added to the new production map by generalising the corresponding polygons in the terrain database of the National Land Survey of Finland (NLS). In connection with the generation of new production map, field observations have been gathered on the overburden thickness and the stratigraphic sequence at a depth of one metre as well as on rock exposures. Coordinate reference system of the Superficial deposits of Finland 1:200 000 (sediment polygons) was transformed in March 2013. The transformation from Finnish National Grid Coordinate System (Kartastokoordinaattijärjestelmä, KKJ) Uniform Coordinate Frame to ETRS-TM35FIN projection was done by using the three-dimensional transformation in accordance with the recommendations for the public administration JHS154.
-
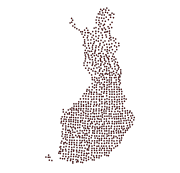
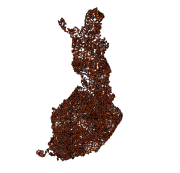
The Regional Till Geochemical Mapping data set gives information on the concentrations of 37 elements in unaltered basal till. The samples have been taken, in 1983, from an unaltered basal till (C horizon) below the groundwater table at a depth of ca. 70 cm (variation 50-200 cm) with a density of one sample per 300 km2. The data set covers the whole of Finland with a total sample amount of 1056. The samples are composite field samples. The calculated sample point coordinates entered in the data set have been obtained from the centroid coordinates of five subsamples. The subsamples have been collected from a 300 m x 1000 m rectangular-shaped area. In Northern Finland, samples have been obtained by including samples taken previously in the Nordkallot Project. The samples have been sieved for analysis at a grain size grade less than 0.06 mm. The samples have been analysed for total elemental concentrations and aqua regia concentrations. Total concentrations have been determined either by neutron activation analysis (method code 900N) or by total dissolution with strong concentrated mineral acids (method code 312P). The analysis code for aqua regia dissolution is 511P. Gold and palladium have been determined with a analysis method based on flameless atomic absorption (519U). The sulfur concentration has been determined with a LECO analyser (810L). Further, total concentrations (312P) and aqua regia soluble concentrations (511P) were determined from Southern Finland and Mid-Finland samples with a grain size grade less than two millimetres. The original purpose of the Regional Till Geochemical Mapping data set was national geochemical general mapping and ore exploration. Other uses are, for example, estimating the baseline concentration of the soil, the nutrient levels of forest soil, assessing the buffering capacity of base cations in the soil and evaluating the weathering rate.
-
The EMODnet (European Marine Observation and Data network) Geology project collects and harmonizes marine geological data from the European sea areas to support decision making and sustainable marine spatial planning. The partnership includes 39 marine organizations from 30 countries. The partners, mainly from the marine departments of the geological surveys of Europe (through the Association of European Geological Surveys-EuroGeoSurveys), have assembled marine geological information at various scales from all European sea areas (e.g. the White Sea, Baltic Sea, Barents Sea, the Iberian Coast, and the Mediterranean Sea within EU waters). This dataset includes EMODnet seabed substrate maps at a scale of 1:5 000 from the European marine areas. Traditionally, European countries have conducted their marine geological surveys according to their own national standards and classified substrates on the grounds of their national classification schemes. These national classifications are harmonised into a shared EMODnet schema using Folk's sediment triangle with a hierarchy of 16, 7 and 5 substrate classes. The data describes the seabed substrate from the uppermost 30 cm of the sediment column. Further information about the EMODnet Geology project is available on the portal (http://www.emodnet-geology.eu/).
-
The data set relating to overall mapping of national peat resources contains by focus area those mires over 20 ha in extent that are most important from a peat production perspective. Since 1975 additional smaller areas have been included as required. For each mire, there are data on mire type, peat type, peat reserves, peat physical properties, mires that are suitable for peat production, peat quality and exploitable peat reserves. This information is published in municipality-specific peat investigation reports that present general information on each mire investigated and their applicability to energy, horticultural and environmental peat production as well as to protection purposes, among other uses.
-
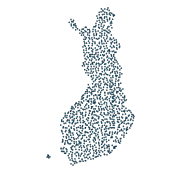
The Regional Stream Water Geochemical Mapping data set gives information on the elemental concentrations in organic sediments of small headwater streams. The samples have been taken from small headwater streams (catchment area under 30 km2) in the late summer of 1990. Sampling has been repeated for about every fourth point during the years 1995, 2000 and 2006. The number of samples was 1162 in 1990 (at a density of one sample / 300 km2), 286 in 1995, 286 in 2000 and 249 in 2006. The data set covers the whole of Finland. Stream water samples have also been taken at the same time. Sampling, processing and analysis methods have been described in the Geochemical Atlas of Finland, Part 3, p. 27 - 30 (Lahermo et. al 1996). Field observations, coordinates and element concentrations determined from samples have been made into a database, in which each record represents one sample point. The data for each sampling year have been recorded on different tables. The method of analysis is referred to with a four-character method code. The codes are as follows: 503H = mercury determination using the cold vapour method 503P = nitric acid extraction in a microwave oven, measurement with ICP-AES 503M = nitric acid extraction in a microwave oven, measurement with ICP-MS 820L = carbon, hydrogen and nitrogen determination with a LECO analyser. The element concentration data include a numerical concentration value (as mg kg-1 or ppm) and possibly a check mark. The concentration is recorded as a variable, which has a name that comprises the chemical symbol for the element and the code for the method of analysis. For example AS_503M is arsenic (As) concentration, which is determined with the ICP-MS method (503M). The next variable has a check mark, for example AS_503MT. If the numerical value following the check mark is ‘>’ or '‘<’ then the number recorded in the concentration field is the determination limit of the chemical analytical method used and the actual concentration is less than this value. If the check mark is an exclamation mark (!), the analytical result is smaller than the determination limit of the analytical method use but the (unreliable) value obtained with the measuring instrument has been entered in the database. There is no data are if the check mark is a 'x'. The original purpose of the Regional Stream Water Geochemical Mapping data set was national general geochemical mapping and the basic assessment of environmental state. Other uses are, for example, the assessment of changes in environmental state and determination of the baseline concentrations of surface water as part of the evaluation of the chemical state of catchment areas in accordance with the Water Framework Directive of the EU.
-
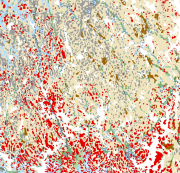
Seabed substrate 1:1 000 000 is one of the products produced in the EMODnet (European Marine Observation and Data network) Geology EU project. Project provided seabed geological material from the European maritime areas. The EMODnet Geology project (http://www.emodnet-geology.eu/) collects and harmonizes geological data from the European sea areas to support decision-making and sustainable marine spatial planning. The EMODnet Geology partnership has included 36 marine organizations from 30 countries. This data includes the EMODnet seabed substrate map at a scale of 1:1 000 000 from the Finnish marine areas. It is based on the data produced on a scale of 1:20 000 by the Geological Survey of Finland (GTK). The data has been harmonized and reclassified into five Folk substrate classes (clay + silt (mud), sandy clays, clayey sands, coarse sediments, mixed sediments) and bedrock. The data describes the seabed substrate from the uppermost 30 cm of the sediment column. The data have been generalized into a target scale (1:1 000 000). The smallest cartographic unit within the data is 4 km2. Further information about the EMODnet-Geology project is available on the portal (http://www.emodnet-geology.eu/).
-
Seabed substrate 1:100 000 is one of the products produced in the EMODnet (European Marine Observation and Data network) Geology III EU project. Project provided seabed geological material from the European maritime areas. The EMODnet Geology III project (http://www.emodnet-geology.eu/) collects and harmonizes geological data from the European sea areas to support decision-making and sustainable marine spatial planning. The EMODnet Geology partnership has included 39 marine organizations from 30 countries. This data includes the EMODnet seabed substrate map at a scale of 1:100 000 from the Finnish marine areas. It is based on the data produced on a scale of 1:20 000 by the Geological Survey of Finland (GTK). The data has been harmonized and reclassified into five Folk substrate classes (clay + silt (mud), sandy clays, clayey sands, coarse sediments, mixed sediments) and bedrock. The data describes the seabed substrate from the uppermost 30 cm of the sediment column. The data have been generalized into a target scale (1:100 000). The smallest smallest cartographic unit within the data is 0.05 km2 (5 hectares). Further information about the EMODnet-Geology project III is available on the portal (http://www.emodnet-geology.eu/). Permission (AN17367) to publish the material was obtained from the Finnish Defence Office 29.9.2017.
-
The database consists of three components: "Published age determination”, ”Published Sm-Nd isotope data" and "Pb isotope data on galena". The "Published age determination" database is based on age determinations, which comprise predominantly U-Pb zircon data produced at the Geological Survey of Finland since 1960’s. For igneous rocks the age register contains radiometric ages mostly interpreted as primary ages. The information given consists of location data, rock type, method, mineral analyzed, age results, comments and references. "Published Sm-Nd isotope data" comprise Sm-Nd data procuded at GTK since 1981, which mostly are used to constrain the origin of crust. "Pb isotope data on galena" gives results produced at GTK since 1970's, and include also previously unpublished data.